Explore the state-by-state map
Switch between the overall Environmental Pressure Index and the individual data points behind it. Hover or tap a state for a quick snapshot.
Darker states have higher values for the selected metric. Use the tabs to switch between the overall index and each data point. Gray states had no data centers in development in the source dataset and are excluded from the ranking.
Top states by Environmental Pressure Index
State rankings
Compare how data center development, listed species, forest cover and drought pressure shape each state’s overall score.
| Rank | State | Data Centers in Development | Endangered Species | Forest Cover (%) | DSCI Score | Environmental Pressure Index |
|---|
Ground-Level Impact
While our Environmental Pressure Index maps the systemic threat, these visualizations illustrate what this industrial expansion actually looks like on the ground.
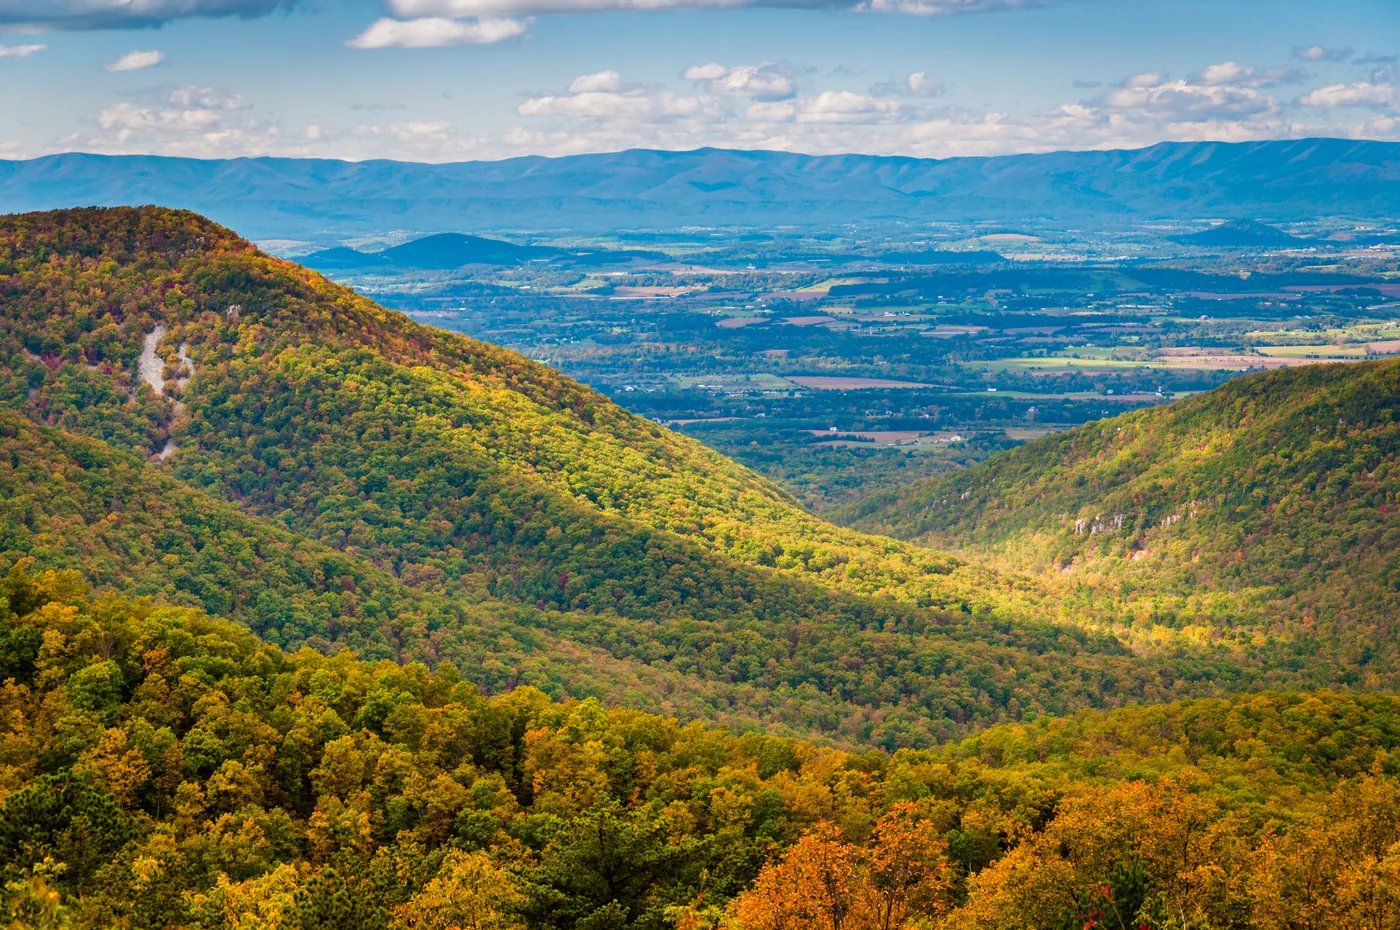

High-voltage corridors through the Blue Ridge.
The Blue Ridge mountains are meant to be wild, but to keep our digital world running, we are carving high-voltage power lines right through the heart of these forests. This turns a living, breathing canopy into a scarred path of steel and dirt. As a 2026 report from the National Parks Conservation Association warns, this kind of rapid expansion is fragmenting wildlife habitats across the Mid-Atlantic, forcing us to trade our national heritage for more server capacity.
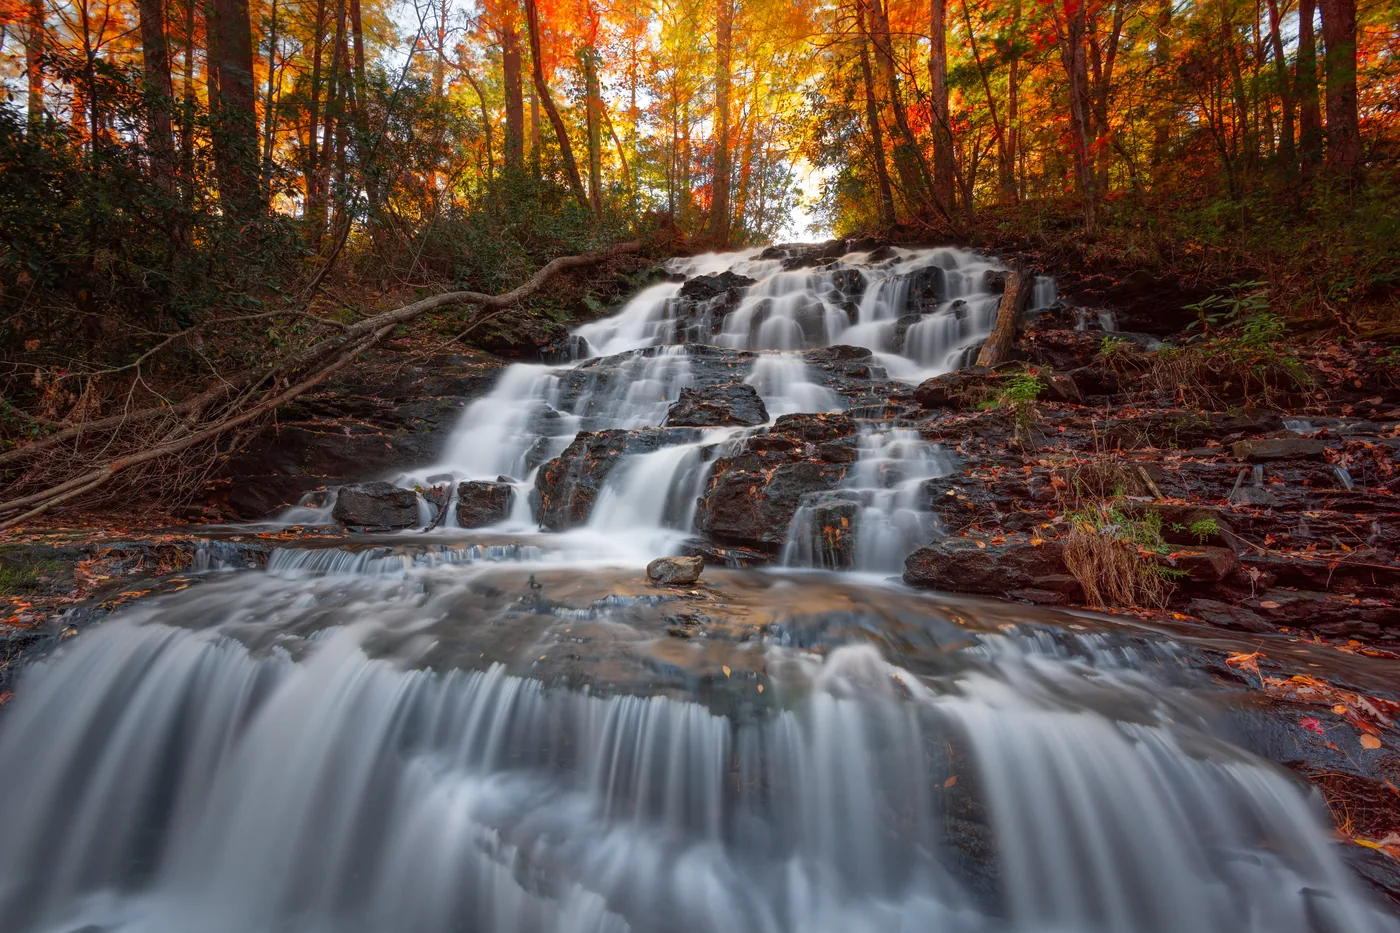
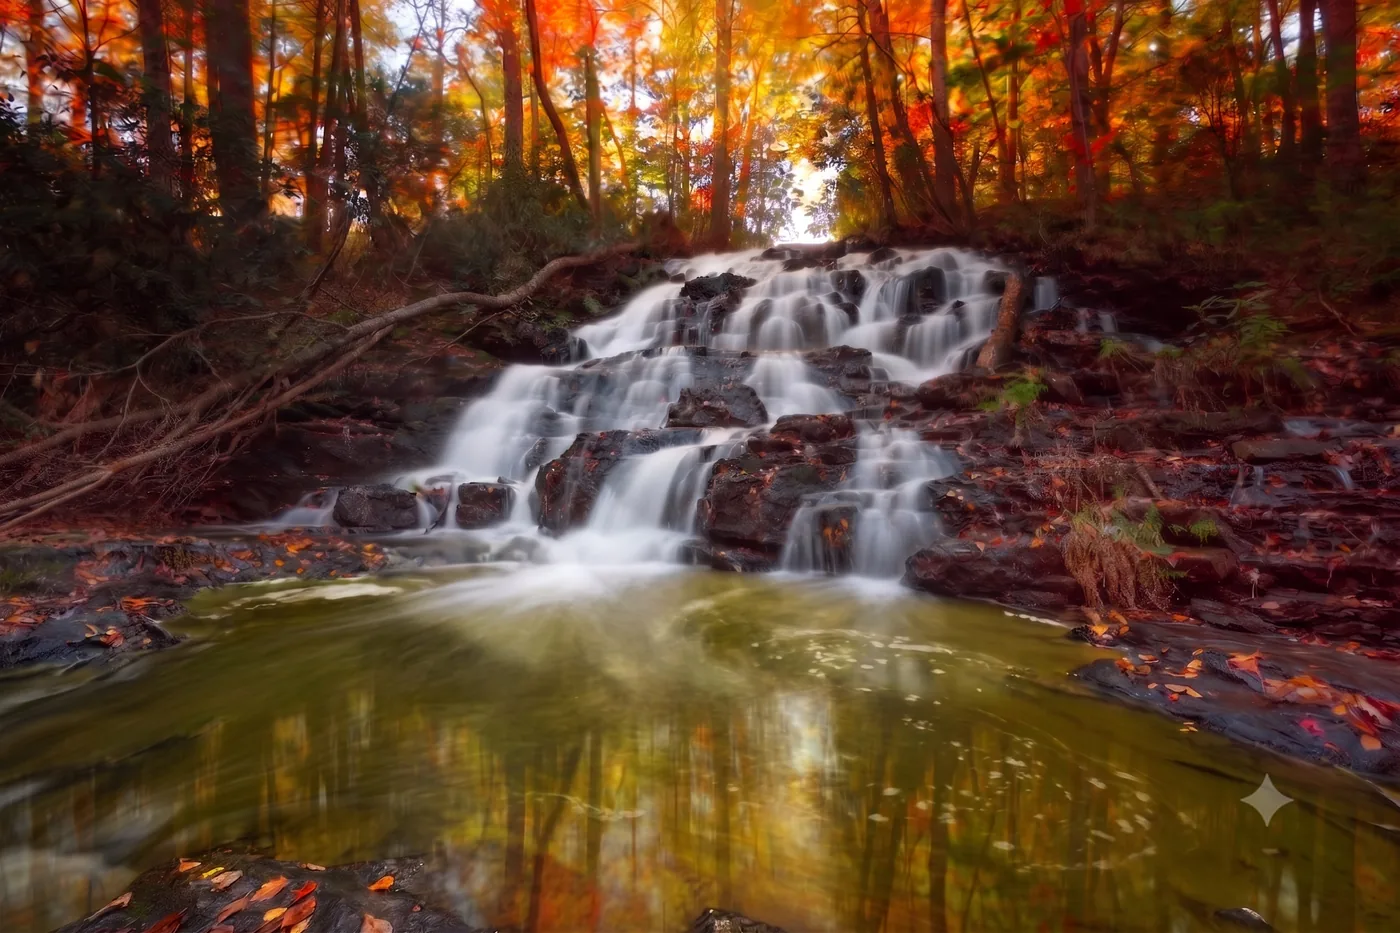
Cooling demand and water stress.
Vogel State Park sits in the North Georgia mountains, where forests, lake habitat and cold-water streams depend on a careful water balance. Data centers can put that balance under pressure. They pull in large volumes of water to keep servers cool, then can return warmer water to local systems. According to 2026 field research from the University of Georgia, this kind of artificial heat can lower water quality, stress aquatic life and increase the risk of harmful algae growth. For places built around clean water and mountain habitats, that pressure matters.
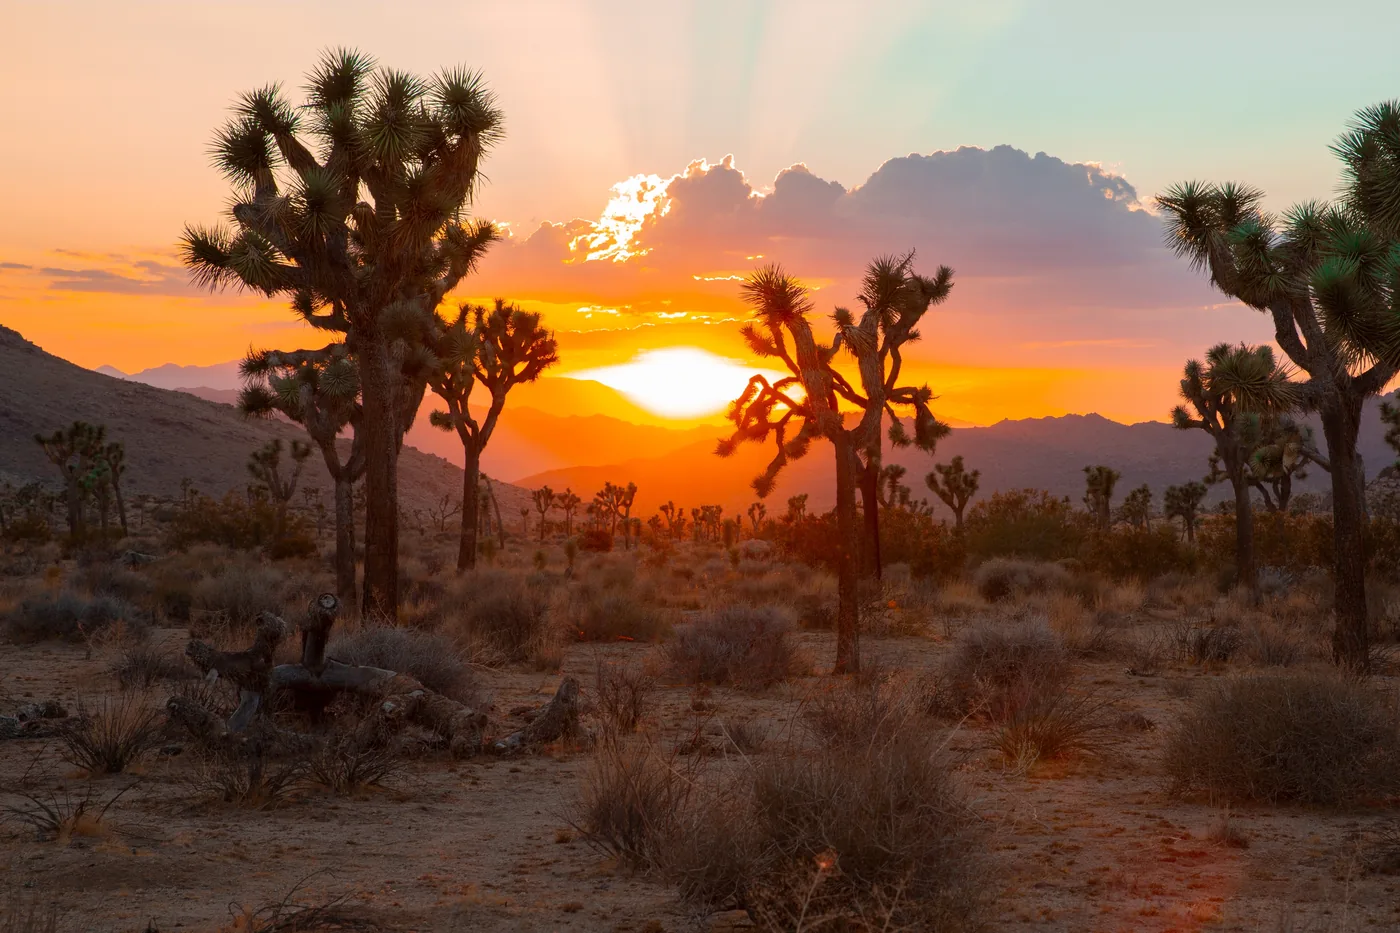
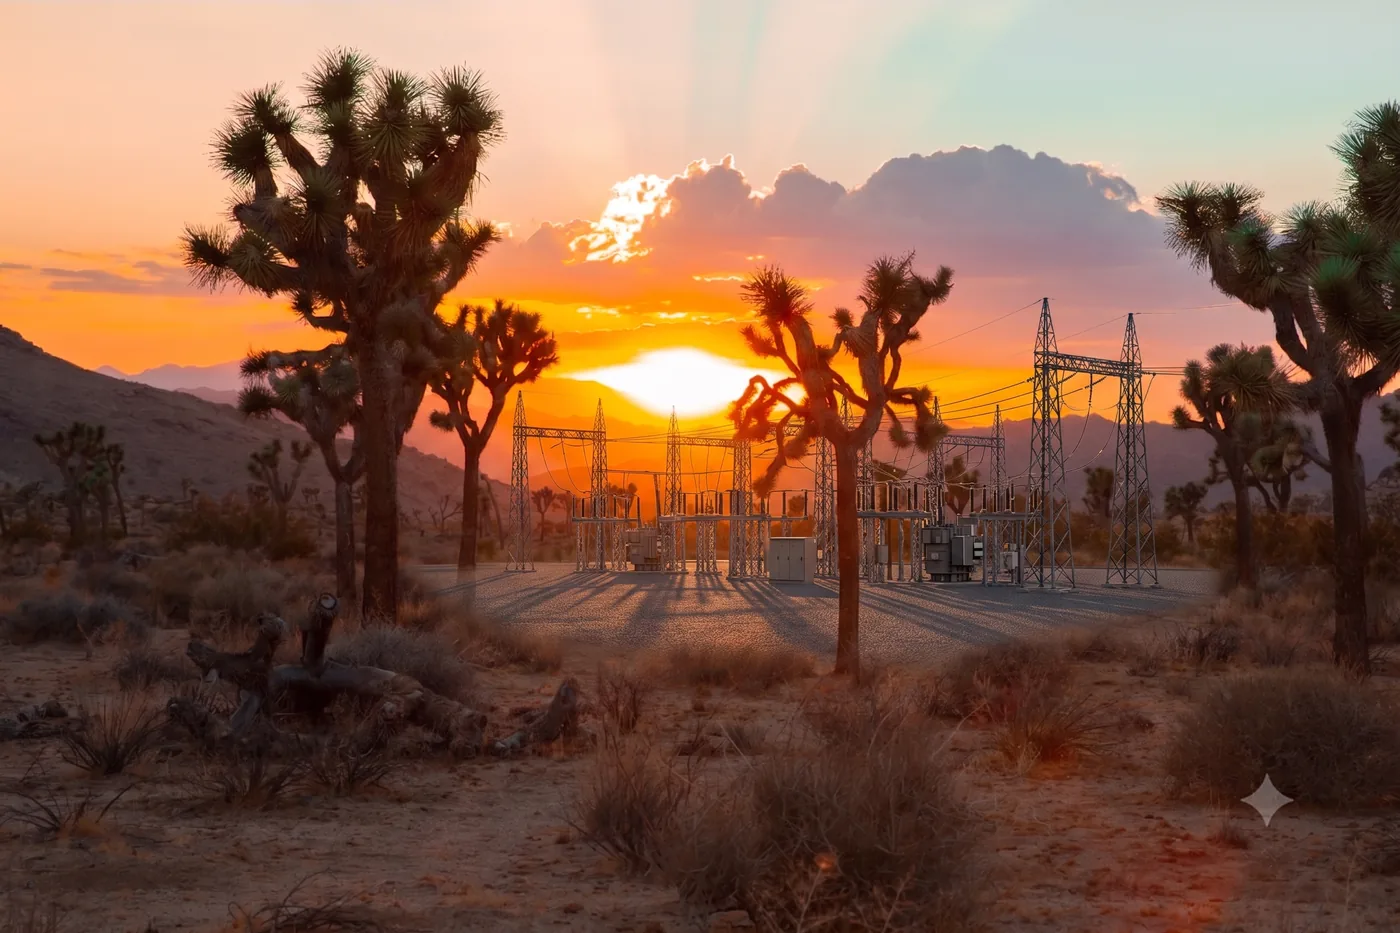
Industrial energy buildout on fragile desert ground.
Joshua Tree is famous for its stark beauty and the ancient, twisted trees that have stood for centuries. But the desert floor is a fragile, living surface that takes decades to recover from even a single disturbance. Now, we are scraping these plains flat to build massive industrial power stations. The National Park Service has identified industrial energy development as a threat to Joshua Tree’s long-term survival, putting more pressure on a landscape that has existed for thousands of years.
Methodology
Outforia built this study to understand where the next wave of data center construction could overlap with states already carrying nature pressure.
We started with each state’s data center development pipeline. This includes facilities listed by Data Center Map as planned, under construction or land banked. Operating, uncertain and canceled facilities were excluded so the ranking focuses on future buildout rather than existing infrastructure.
We then layered in three nature-focused signals: federally listed threatened and endangered species, forest cover and drought pressure. Forest cover is treated as habitat exposure rather than a “bad” condition, because states with more canopy may have more natural landscape that could be sensitive to large infrastructure expansion. Drought pressure is measured using the U.S. Drought Monitor’s Drought Severity and Coverage Index, which ranges from 0 to 500.
How the score was calculated
Each input was converted to a comparable 0 to 100 scale. Outforia then averaged the three environmental signals to create an environmental vulnerability base score and applied data center development as a pressure multiplier.
Environmental Pressure Index = Environmental vulnerability base × data center development multiplier.
Important context: The Environmental Pressure Index highlights state-level overlap, not direct impact. Individual projects can vary widely by location, design, water use, mitigation and local permitting.
Sources
- Data center pipeline: Data Center Map, including planned, under construction and land-banked facilities.
- Threatened and endangered species: U.S. Fish & Wildlife Service ECOS state listing totals.
- Forest cover: World Population Review forest cover data.
- Drought pressure: U.S. Drought Monitor Drought Severity and Coverage Index data, using the latest state reading available for this study: June 9, 2026.
The ranking excludes states with no data centers in development in the dataset. These states are shaded gray on the map: Hawaii, Massachusetts, New Hampshire, Rhode Island, and Vermont.